Managing my various web sites can be difficult at times, and my experience the other weekend was no different. My day started normally enough, as I logged onto my VPS and installed the latest security patches, then set to work on uploading new photos to my site. It was then I noticed my web site was taking minutes to load pages, not seconds, so I started to dig into the cause.
My initial setup
After I moved from shared web hosting, my collection of websites had been running on a $5 / month VPS from Digital Ocean – for that I got 1 CPU, 512 MB of RAM, and 20 GB of disk space. On top of that I used an out-of-the-box Ubuntu image, and installed Apache for the web server and MySQL for the database server.
I then installed a number of separate WordPress instances for my blogs, a few copies of Zenphoto to drive my different photo galleries, and then a mishmash of custom code for a number of other side projects. All of that is exposed via four different domain names, all of which sit behind the CloudFlare CDN to reduce the load on my server.
With some many web sites running on just 512 MB of RAM, performance was an issue! My first fix was to setup a 1 GB swap file to give some breathing room, which did stabilise the situation, but MySQL would still crash every few days when the server ran out of memory.
Swapping out Apache for the much less memory intensive Nginx web server is one way to fix the issue, but I didn’t have time for that. My solution – cron jobs to check the status of my server and restart the services as required!
The first script I came up with checked if the MySQL service was running, and start it up if it wasn’t.
service mysql status| grep 'mysql start/running' > /dev/null 2>&1

if [ $? != 0 ]

then

SUBJECT="MySQL service restarted $(date)"

service mysql status|mail -s "$SUBJECT" [email protected]

sudo service mysql start

fi
My second attempt negated the need for the first script, as it checked to see how much memory was free on my server, and restarted Apache if it was less than a given threshold.
#Minimum available memory limit, MB

THRESHOLD=300
available=$(free -m|awk '/^Swap:/{print $4}')
if [ $available -lt $THRESHOLD ]
then
SUBJECT="Apache service restarted $(date)"
service apache2 status|mail -s "$SUBJECT" [email protected]
sudo service apache2 restart
fi
Under normal load my cron job would restart Apache every day or so, but it did keep the database server up for the rest of the time.
Something is not right
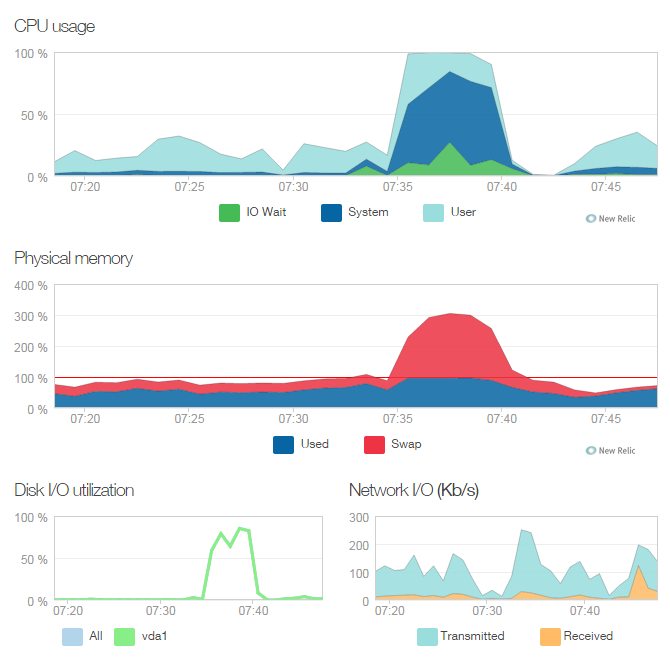
After realising my web site was taking minutes to load pages, not seconds, I started to dig into my server logs. CPU load was hitting 100%, as was memory consumption, and my cron job was restarting Apache every few minutes – something wasn’t quite right!
My first avenue of investigation was Google Analytics – I wanted to find out if the spike in load was due to a flood of new traffic. While the Slashdot effect is a nice problem to have, but in my case it wasn’t to be – incoming traffic was normal.
I then took a look at my Apache access logs – they are split up by virtual host, so I had a number of log files to check out. The first suspicious entries I found were brute force attacks on my WordPress login pages – blocking those was simple, but the server load was still high.
Spending my way out
When looking to upgrade a system to handle more traffic, there are two completely different ways to go about it:
- Be smart and optimise what you already have, to do more with the same resources
- Throw more resources at the problem, and just ignore the cause
My server was already nearing the 20 GB disk space limitation set by Digital Ocean on their $5 / month VPS, so I figured an upgrade to next size VPS might fix my problem. Upgrading a Digital Ocean ‘droplet’ is simple job with their ‘Fast-Resize’ functionality – it takes about a minute, but in my case the option wasn’t available – I had to do it the hard way:
- shut down my server,
- create a snapshot of the stopped virtual machine,
- spin up a new Digital Ocean server,
- restore my snapshot to the new server,
- point CloudFlare from my old server IP address to the new one.
All up it took around 30 minutes to migrate from my old server to my new one, but at least with CloudFlare being my public facing DNS host, I didn’t have to wait hours for my new IP address to propagate across the internet!
Unfortunately, the extra resources didn’t fix my problem – CPU load was still through the roof.
Digging for the root cause
I first installed the htop process viewer on my server, and was able to see that MySQL was using up far much more CPU than normal – presumably my caching wasn’t working right, and my web pages were having to be generated with fresh database queries each time.
Next I fired up a MySQL console, and had a look at the currently running queries. Here I noticed a curious looking query over and over again:
SELECT @serachfield ...
A check of the code deployed to my server indicated that the query was thanks to the search function in Zenphoto, and when I went back into my Apache access logs, I eventually found the problem – a flood of hits on my photo gallery.

Each line in the logs looked like the following:
108.162.250.234 – – [21/Dec/2014:04:32:03 -0500] “GET /page/search/maintenance/js-agent.newrelic.com/js-agent.newrelic.com/js-agent.newrelic.com/maintenance/js-agent.newrelic.com/js-agent.newrelic.com/js-agent.newrelic.com/js-agent.newrelic.com/maintenance/js-agent.newrelic.com/js-agent.newrelic.com/js-agent.newrelic.com/maintenance/js-agent.newrelic.com/js-agent.newrelic.com/js-agent.newrelic.com/js-agent.newrelic.com/js-agent.newrelic.com/js-agent.newrelic.com/maintenance/js-agent.newrelic.com/js-agent.newrelic.com/js-agent.newrelic.com/maintenance/js-agent.newrelic.com/js-agent.newrelic.com/js-agent.newrelic.com/js-agent.newrelic.com/maintenance/js-agent.newrelic.com/js-agent.newrelic.com/js-agent.newrelic.com/maintenance/js-agent.newrelic.com/js-agent.newrelic.com/js-agent.newrelic.com/js-agent.newrelic.com/js-agent.newrelic.com/js-agent.newrelic.com/maintenance/js-agent.newrelic.com/js-agent.newrelic.com/js-agent.newrelic.com/maintenance/js-agent.newrelic.com/js-agent.newrelic.com/js-agent.newrelic.com/js-agent.newrelic.com/maintenance/js-agent.newrelic.com/js-agent.newrelic.com/js-agent.newrelic.com/maintenance/js-agent.newrelic.com/js-agent.newrelic.com/js-agent.newrelic.com/js-agent.newrelic.com/js-agent.newrelic.com/js-agent.newrelic.com/maintenance/js-agent.newrelic.com/js-agent.newrelic.com/js-agent.newrelic.com/maintenance/js-agent.newrelic.com/js-agent.newrelic.com/js-agent.newrelic.com/js-agent.newrelic.com/maintenance/js-agent.newrelic.com/js-agent.newrelic.com/js-agent.newrelic.com/maintenance/js-agent.newrelic.com/js-agent.newrelic.com/js-agent.newrelic.com/js-agent.newrelic.com/js-agent.newrelic.com/js-agent.newrelic.com/beacon-3.newrelic.com HTTP/1.1” 404 2825 “https://railgallery.wongm.com/page/search/maintenance/js-agent.newrelic.com/js-agent.newrelic.com/js-agent.newrelic.com/maintenance/js-agent.newrelic.com/js-agent.newrelic.com/js-agent.newrelic.com/js-agent.newrelic.com/maintenance/js-agent.newrelic.com/js-agent.newrelic.com/js-agent.newrelic.com/maintenance/js-agent.newrelic.com/js-agent.newrelic.com/js-agent.newrelic.com/js-agent.newrelic.com/js-agent.newrelic.com/js-agent.newrelic.com/maintenance/js-agent.newrelic.com/js-agent.newrelic.com/js-agent.newrelic.com/maintenance/js-agent.newrelic.com/js-agent.newrelic.com/js-agent.newrelic.com/js-agent.newrelic.com/maintenance/js-agent.newrelic.com/js-agent.newrelic.com/js-agent.newrelic.com/maintenance/js-agent.newrelic.com/js-agent.newrelic.com/js-agent.newrelic.com/js-agent.newrelic.com/js-agent.newrelic.com/js-agent.newrelic.com/maintenance/js-agent.newrelic.com/js-agent.newrelic.com/js-agent.newrelic.com/maintenance/js-agent.newrelic.com/js-agent.newrelic.com/js-agent.newrelic.com/js-agent.newrelic.com/maintenance/js-agent.newrelic.com/js-agent.newrelic.com/js-agent.newrelic.com/maintenance/js-agent.newrelic.com/js-agent.newrelic.com/js-agent.newrelic.com/js-agent.newrelic.com/js-agent.newrelic.com/js-agent.newrelic.com/maintenance/js-agent.newrelic.com/js-agent.newrelic.com/js-agent.newrelic.com/maintenance/js-agent.newrelic.com/js-agent.newrelic.com/js-agent.newrelic.com/js-agent.newrelic.com/maintenance/js-agent.newrelic.com/js-agent.newrelic.com/js-agent.newrelic.com/maintenance/js-agent.newrelic.com/js-agent.newrelic.com/js-agent.newrelic.com/js-agent.newrelic.com/js-agent.newrelic.com/js-agent.newrelic.com/nr-476.min.js” “Mozilla/4.0 (compatible; MSIE 8.0; Windows NT 6.0; Trident/4.0; .NET CLR 2.0.50727; .NET CLR 1.1.4322; .NET CLR 3.0.04506.30; .NET CLR 3.0.04506.648)”
Each request was bound for “http://js-agent.newrelic.com/nr-476.min.js” or other files hosted at newrelic.com, and the user agent always appeared to be Internet Explorer 8.
New Relic is a software analytics tool I have installed on my server, and on seeing the multiple references to it in my access logs, I remembered that I had updated my version of the New Relic agent just before my performance issues had started. Had I found a bug in it?
The cause
A check of the HTML source of the page in question showed a link to js-agent.newrelic.com embedded in the page, so I came up with the following explanation for the load on my server:
- A user hits https://railgallery.wongm.com/page/search/SEARCH_TERM
- The New Relic Javascript file at http://js-agent.newrelic.com/nr-476.min.js somehow gets loaded as a relative path, and not an absolute one, which results in a request to:
https://railgallery.wongm.com/page/search/SEARCH_TERM/js-agent.newrelic.com/nr-476.min.js - My server would then treat the above URL as valid, delivering a page, which then includes a relative link to js-agent.newrelic.com/nr-476.min.js a second time, which then results in a page request to this URL:
https://railgallery.wongm.com/page/search/SEARCH_TERM/js-agent.newrelic.com/js-agent.newrelic.com/nr-476.min.js - And so on recursively:
https://railgallery.wongm.com/page/search/SEARCH_TERM/js-agent.newrelic.com/js-agent.newrelic.com/js-agent.newrelic.com/nr-476.min.js
With the loop of recursive page calls for a new set of search results, each requiring a fresh database query, it was no wonder my database server was being hit so hard.
As an interim fix, I modified the Zenphoto code to ignore search terms that referenced New Relic, and then rolled back to the older version of the New Relic agent.
sudo apt-get remove newrelic-php5

sudo apt-get remove newrelic-php5-common

sudo apt-get remove newrelic-daemon

sudo apt-get autoremove newrelic-php5

sudo apt-get install newrelic-php5-common=4.15.0.74

sudo apt-get install newrelic-daemon=4.15.0.74

sudo apt-get install newrelic-php5=4.15.0.74
I then raised a support case for New Relic to look into my issue. In an attempt to reproduce the issue, I rolled forward with the current version of the New Relic agent to play ‘spot the difference’, but I couldn’t find any, and the errors also stayed away.
I’m writing this one off as a weird conflict between the updated New Relic agent running my server, and an old version of the browser monitor javascript file cached by a single remote user.
Conclusion
After working through my performance issues I now know more about what my web server is doing, and the extra RAM available following the upgrade means my horrible cron job hacks are no longer required to keep the lights on!
As for the steps I will follow next time, here are the places to check:
- Google Analytics to check if I am getting a flood of legitimate traffic,
- Apache access logs for any odd looking sources of traffic,
- current process list to see where the CPU usage is coming from,
- currently running MySQL queries for any reoccurring patterns.

Gosh, that’s your longest post ever!
I ran a query,and my top three longest blog posts are these:
– http://wongm.com/2013/03/abandoned-ford-factory-geelong/
– http://wongm.com/2014/01/regional-rail-link-precursor-plans/
– http://wongm.com/2012/12/melbourne-metro-rail-tunnel-detailed-plans/
Awesome.